What's this house worth?
Estimate what a Melbourne property might sell for, with an honest 80% range. 23 steps, all shown in full: leakage review, time-based evaluation, tuned models, conformal prediction intervals, error analysis by area, an API and a monitoring plan.
Frame the problem: an estimate and a range
A single number pretends to know more than it does. The job here is to give a buyer or seller a realistic range for what a property might sell for, and to be honest about how wide that range is. Write down the user, the decision, the timing and what the model must not be used for before touching data.
| Question | Answer |
|---|---|
| User | A buyer, seller or analyst researching a Melbourne property |
| Output | An estimate plus an 80% interval, in dollars |
| Prediction time | Before the sale: only facts about the property, its location and the valuation date |
| Success | Median % error on later sales, share within 10% and 20%, interval coverage near 80% for every property type |
| Not for | Lending, insurance or rental decisions without a professional valuation |
docs/problem_framing.md (excerpt)8 lines
## Success measures
| level | measure | target |
|---|---|---|
| Model | median absolute % error on later sales (test period) | clearly better than a median-price baseline |
| Model | share of estimates within 10% / 20% of the sale price | reported with the above |
| Uncertainty | 80% interval coverage on the test period | 75–85%, also by property type |
| Equity | % error by property type, region and price band | no group above 1.5× the overall error without a written note |
| Operations | API p95 latency for 100 properties | under 300 ms |configs/config.yaml45 lines
# All settings for the house-price project. Change values here, never in code.
project:
  name: housing
  seed: 42

paths:
  raw_csv: data/raw/melb_data.csv
  interim: data/interim/sales_clean.parquet
  features: data/processed/features.parquet
  model_dir: models
  reports: reports
  runs: runs

data:
  kaggle_dataset: dansbecker/melbourne-housing-snapshot
  expected_rows_min: 13000          # the real file has 13,580 rows
  min_year_built: 1800              # older values are data-entry errors (the file contains 1196)
  max_building_area: 3000           # square metres; larger values are treated as errors

split:
  # Time-based: train on earlier sales, validate and test on later ones (how a valuation model is used).
  validation_fraction: 0.15
  test_fraction: 0.15
  cv_folds: 5                       # GroupKFold by address inside the training period (resales stay together)

features:
  suburb_min_frequency: 20          # rarer suburbs are grouped as "other" in the linear model

training:
  primary_metric: neg_mean_absolute_error   # on log price: equivalent to typical percentage error
  tuning_iterations: 20
  candidate_models: [dummy, ridge, hist_gradient_boosting]

intervals:
  coverage: 0.80                    # 80% prediction intervals from split-conformal calibration
  adaptive: true                    # scale interval width by a model of how hard each property is

evaluation:
  bootstrap_samples: 1000
  error_groups: [type, region]      # accuracy must hold across property types and regions
  max_group_mape_ratio: 1.5         # flag a group whose percentage error is 1.5x the overall

monitoring:
  psi_warn: 0.10
  psi_alert: 0.25
Reuse a professional repository layout
The structure, tooling and quality gates are the same as Project 1: an installable package under
src/, typed config, pinned dependencies, a Makefile with one command per step, ruff, mypy in strict mode, pytest, pre-commit and CI.
Reusing a proven layout is itself an industry practice: every project in a team should feel familiar.
Makefile54 lines
# One command per pipeline step. Run `make help` to list them.
PY ?= python
CONFIG ?= configs/config.yaml

.PHONY: help install data synthetic validate prepare eda train evaluate report serve test lint typecheck check all clean docker

help:          ## List the available commands
	@grep -E '^[a-z-]+:.*## ' Makefile | sed 's/:.*## /\t/'

install:       ## Install pinned dependencies and the package in editable mode
	$(PY) -m pip install -r requirements-dev.txt && $(PY) -m pip install -e . --no-deps && pre-commit install

data:          ## Download the real dataset from Kaggle (needs a Kaggle API token)
	$(PY) -m housing.cli download --config $(CONFIG)

synthetic:     ## Create a full-size synthetic dataset with the same schema (no account needed)
	$(PY) scripts/make_synthetic.py --rows 13580 --out data/raw/melb_data.csv

validate:      ## Check the raw data against the schema
	$(PY) -m housing.cli validate --config $(CONFIG)

prepare:       ## Clean the data and build point-in-time features
	$(PY) -m housing.cli prepare --config $(CONFIG)

eda:           ## Write the exploratory data analysis report and figures
	$(PY) -m housing.cli eda --config $(CONFIG)

train:         ## Tune and train the candidate models, select the best, calibrate it
	$(PY) -m housing.cli train --config $(CONFIG)

evaluate:      ## Final test-set evaluation, fairness, explanations and model card
	$(PY) -m housing.cli evaluate --config $(CONFIG)

all: validate prepare eda train evaluate   ## Run the whole pipeline

serve:         ## Run the prediction API locally
	$(PY) -m flask --app "housing.serving.app:create_app()" run --debug --port 8000

test:          ## Run the test suite
	$(PY) -m pytest

lint:          ## Lint and check formatting
	ruff check . && ruff format --check .

typecheck:     ## Static type checks
	mypy

check: lint typecheck test   ## Everything CI runs

docker:        ## Build the serving image
	docker build -t housing-api .

clean:         ## Remove generated data, models and reports
	rm -rf data/interim/* data/processed/* models/* reports/* runs/*
Download with provenance
The Kaggle Melbourne Housing Snapshot (13,580 sales, 21 columns, 2016–2017) is downloaded by script and its checksum recorded.
It is licensed CC BY-NC-SA 4.0 (non-commercial), so the repository never includes it. make synthetic creates a stand-in with the
same columns and quirks for practice and CI.
docs/data_card.md: the data dictionary23 lines
## Columns (raw → clean)
| raw | clean | meaning | notes |
|---|---|---|---|
| Suburb | suburb | suburb name | ~300 values, very unequal counts |
| Address | address | street address | used only to group repeat sales |
| Rooms | rooms | number of rooms | |
| Type | type | h house, t townhouse, u unit/apartment | |
| Price | price | **target**, sale price in AUD | |
| Method | method | S sold, SP sold prior, PI passed in, VB vendor bid, SA sold after auction | **excluded**: describes the sale outcome |
| SellerG | agency | real-estate agency | **excluded**: not a property attribute |
| Date | sale_date | date sold, day/month/year | |
| Distance | distance_km | distance from the Melbourne CBD | |
| Postcode | postcode | | excluded (duplicates suburb) |
| Bedroom2 | bedrooms | bedrooms (scraped from another source) | can disagree with Rooms |
| Bathroom | bathrooms | | |
| Car | car_spaces | car spaces | ~0.5% missing |
| Landsize | land_m2 | land size, m² | often 0 for units (shared land) |
| BuildingArea | building_m2 | floor area, m² | ~47% missing; some zeros |
| YearBuilt | year_built | | ~40% missing; contains 1196 |
| CouncilArea | council | local council | ~10% missing |
| Lattitude / Longtitude | lat / lon | coordinates | misspelled in the source |
| Regionname | region | 8 regions | |
| Propertycount | suburb_property_count | properties in the suburb | |Validate the raw file
Hard errors stop the pipeline: missing columns, missing or non-positive prices, unknown property types or sale methods, dates not in day/month/year format, and coordinates outside Greater Melbourne (a cheap check that catches swapped or corrupted columns). Known quirks are counted as warnings: about 47% of building areas and 40% of build years are missing, and one house was "built" in 1196.
src/housing/data/schema.py59 lines
def validate_raw(df: pd.DataFrame, expected_rows_min: int = 1) -> ValidationReport:
    """Check columns, required values, codes, dates and coordinates."""
    rep = ValidationReport()
    missing = [c for c in RAW_COLUMNS if c not in df.columns]
    if missing:
        rep.errors.append(f"missing columns: {missing}")
        return rep
    extra = [c for c in df.columns if c not in RAW_COLUMNS]
    if extra:
        rep.warnings.append(f"unexpected extra columns (ignored): {extra}")

    n = len(df)
    rep.facts["rows"] = n
    if n < expected_rows_min:
        rep.errors.append(f"only {n} rows; expected at least {expected_rows_min}")
    nulls = df[list(REQUIRED_NON_NULL)].isna().sum()
    if nulls.any():
        rep.errors.append(f"nulls in required columns: {nulls[nulls > 0].to_dict()}")
    if (df["Price"] <= 0).any():
        rep.errors.append(f"{int((df['Price'] <= 0).sum())} non-positive prices")
    bad_type = sorted(set(df["Type"].dropna().unique()) - TYPES)
    if bad_type:
        rep.errors.append(f"unknown Type codes: {bad_type}")
    bad_method = sorted(set(df["Method"].dropna().unique()) - METHODS)
    if bad_method:
        rep.errors.append(f"unknown Method codes: {bad_method}")
    if (df["Rooms"] < 1).any():
        rep.errors.append("Rooms below 1")
    dates = pd.to_datetime(df["Date"], format="%d/%m/%Y", errors="coerce")
    if dates.isna().any():
        rep.errors.append(f"{int(dates.isna().sum())} Date values not in day/month/year format")
    lat_bad = ~df["Lattitude"].between(*LAT_RANGE)
    lon_bad = ~df["Longtitude"].between(*LON_RANGE)
    if (lat_bad | lon_bad).any():
        rep.errors.append(f"{int((lat_bad | lon_bad).sum())} coordinates outside Greater Melbourne")

    for col in ("BuildingArea", "YearBuilt", "Car", "CouncilArea"):
        k = int(df[col].isna().sum() + (df[col].astype("string").str.strip() == "").sum())
        rep.facts[f"missing_{col}"] = k
        if k:
            rep.warnings.append(f"{col}: {k} missing ({k / n:.1%})")
    for name, mask in (
        ("building_area_zero", df["BuildingArea"] == 0),
        ("year_built_before_1800", df["YearBuilt"] < 1800),
    ):
        rep.facts[name] = int(mask.sum())
        if mask.any():
            rep.warnings.append(
                f"{int(mask.sum())} rows with {name.replace('_', ' ')} (set to missing in cleaning)"
            )
    resales = int(df.duplicated(["Address", "Suburb"]).sum())
    rep.facts["repeat_sales_of_same_address"] = resales

    if not rep.errors:
        rep.facts["median_price"] = float(df["Price"].median())
        rep.facts["date_min"] = str(dates.min().date())
        rep.facts["date_max"] = str(dates.max().date())
        rep.facts["suburbs"] = int(df["Suburb"].nunique())
return repClean by repairing, not deleting
Deleting every row with a problem would throw away half the data. Instead, impossible values in optional columns (a zero building area,
a build year of 1196, a build year after the sale) are set to missing, and the model learns from missingness. Only exact duplicate rows
are removed. Every rule is counted in reports/cleaning_log.json.
src/housing/data/clean.py: repair rules14 lines
repairs: list[tuple[str, str, pd.Series]] = [
    (
        "building_area_zero_or_huge",
        "building_m2",
        (df["building_m2"] <= 0) | (df["building_m2"] > max_building_area),
    ),
    ("year_built_too_old", "year_built", df["year_built"] < min_year_built),
    ("year_built_after_sale", "year_built", df["year_built"] > df["sale_date"].dt.year),
    ("land_zero_for_house", "land_m2", (df["land_m2"] <= 0) & (df["type"] == "h")),
]
for name, col, mask in repairs:
    mask = mask.fillna(False).astype(bool)
    clog.set_missing[name] = int(mask.sum())
df.loc[mask, col] = np.nan if df[col].dtype.kind == "f" else pd.NAExplore the training period only
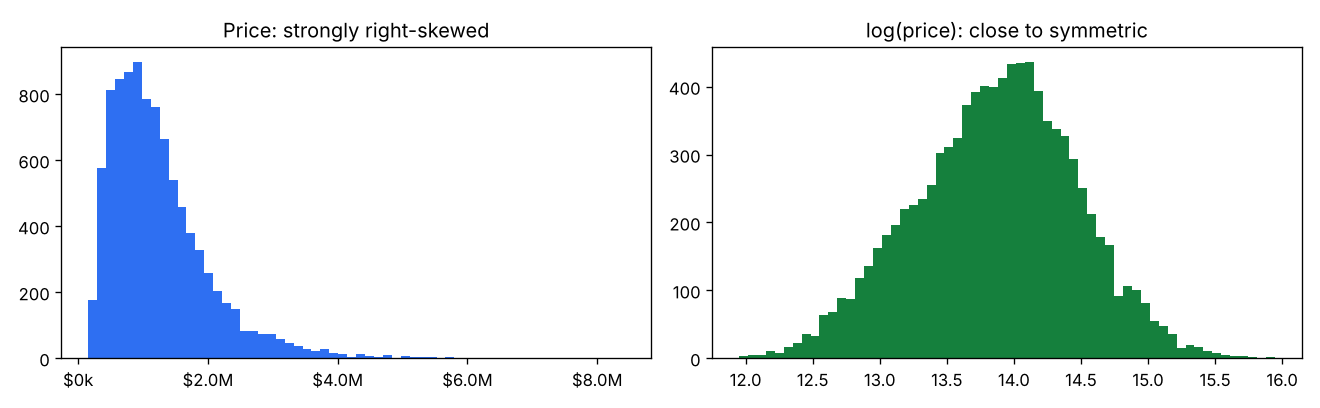
Three findings drive the design:
- Prices are strongly right-skewed, so the model predicts
log(price): errors become relative, and estimates can never be negative. - The market moved during the data period, so the split must be by time and the model needs a time feature.
- Missingness is not random: properties without a recorded building area sell at different prices, so "missing" is information.
Review every column for leakage
Before building features, go through each column and ask: would I know this before the sale?
| Column | Decision | Why |
|---|---|---|
Method | Excluded | Codes such as "passed in" and "vendor bid" describe how the auction went, which happens at the same moment as the price. |
SellerG (agency) | Excluded | Not a property attribute; unknown when valuing. |
Address | Grouping only | Identifies repeat sales of the same property. |
Postcode | Excluded | Duplicates suburb. |
tests/test_features.py3 lines
def test_leaky_and_identifying_columns_are_not_features() -> None:
    for col in ("method", "agency", "address", "price", "postcode", "sale_id"):
assert col not in FEATURESBuild location, size and time features
Location dominates house prices. Distance to the CBD, coordinates, coordinates rotated 45° (so tree splits can follow diagonal
boundaries like the bay), region, and a cross-fitted encoding of suburb and council. Size uses log land and floor area plus area per
room. Age is the sale year minus the build year. months_since_2016 follows the market. The same function builds features for
training and for the API.
src/housing/features/build.py31 lines
def build_features(df: pd.DataFrame) -> pd.DataFrame:
    """Return META + FEATURES (+ TARGET when ``price`` is present) from clean-format rows."""
    out = pd.DataFrame(index=df.index)
    for col in ("rooms", "bedrooms", "bathrooms", "car_spaces", "suburb_property_count"):
        out[col] = pd.to_numeric(df[col], errors="coerce").astype("float64")
    land = pd.to_numeric(df["land_m2"], errors="coerce").astype("float64")
    building = pd.to_numeric(df["building_m2"], errors="coerce").astype("float64")
    out["log_land_m2"] = np.log1p(land)
    out["log_building_m2"] = np.log1p(building)
    out["building_m2_per_room"] = building / out["rooms"]
    sale = pd.to_datetime(df["sale_date"])
    out["property_age"] = sale.dt.year - pd.to_numeric(df["year_built"], errors="coerce").astype("float64")
    out["distance_km"] = df["distance_km"].astype("float64")
    out["lat"], out["lon"] = df["lat"].astype("float64"), df["lon"].astype("float64")
    # Rotated coordinates let tree splits follow diagonal boundaries (bay, freeways) more easily.
    out["rot45_a"] = (out["lat"] + out["lon"]) / np.sqrt(2)
    out["rot45_b"] = (out["lat"] - out["lon"]) / np.sqrt(2)
    out["months_since_2016"] = (sale.dt.year - REFERENCE_DATE.year) * 12 + (
        sale.dt.month - REFERENCE_DATE.month
    )
    out["months_since_2016"] = out["months_since_2016"].astype("float64")
    out["sale_month"] = sale.dt.month.astype("float64")
    out["type"] = df["type"].astype("string")
    for col in ("region", "council", "suburb"):
        out[col] = df[col].astype("string").fillna("Unknown")
    meta = df.reindex(columns=META).copy()
    meta["sale_date"] = sale
    feats = pd.concat([meta, out[FEATURES]], axis=1)
    if "price" in df.columns and df["price"].notna().all():
        feats[TARGET] = np.log(df["price"].astype("float64"))
return featsSplit by date; keep resales together
The test period is the latest 15% of sales, validation the 15% before it. During tuning, GroupKFold by address keeps every sale of the same property in one fold, so the model cannot score well by remembering a property's earlier price.
src/housing/features/split.py6 lines
def address_folds(train: pd.DataFrame, n_splits: int) -> list[tuple[list[int], list[int]]]:
    """GroupKFold indices by property for cross-validation inside the training period."""
    return [
        (list(a), list(b))
        for a, b in GroupKFold(n_splits=n_splits).split(train, groups=property_groups(train))
    ]
tests/test_features.py: a test for it7 lines
def test_repeat_sales_stay_in_one_fold(clean_small: pd.DataFrame) -> None:
    train = time_split(
        build_features(clean_small).assign(suburb=clean_small["suburb"].to_numpy()), 0.15, 0.15
    ).train
    groups = property_groups(train)
    for fit_idx, val_idx in address_folds(train, 4):
assert not set(groups.iloc[fit_idx]) & set(groups.iloc[val_idx])Start with a baseline
The baseline predicts the training period's median price for every property. A model is only saved if it cuts the baseline's validation error by at least 10%.
src/housing/models/train.py: the release gate7 lines
best_name = min((n for n in results if n != "dummy"), key=lambda n: results[n]["validation"]["mae"])
baseline = results.get("dummy", {}).get("validation", {}).get("mae", float("inf"))
gain = 1 - results[best_name]["validation"]["mae"] / baseline
if gain < MIN_RELATIVE_GAIN:
    raise RuntimeError(
        f"best model ({best_name}) cuts the baseline MAE by only {gain:.1%}; refusing to ship it"
)Tune a linear model and gradient boosting
Ridge regression with splines for non-linear effects (distance, age, time), missing-value indicators, and one-hot areas with an "infrequent" bucket. Histogram gradient boosting with native missing values, a cross-fitted target encoding of areas, and a monotonic constraint so more floor area never lowers the estimate. Both are tuned with random search and address-grouped CV; the winner is chosen on the validation period.
src/housing/models/pipelines.py: ridge with splines23 lines
def _ridge(seed: int, min_frequency: int) -> Pipeline:
    linear = [c for c in NUMERIC if c not in SMOOTH]
    pre = ColumnTransformer(
        [
            (
                "num",
                make_pipeline(SimpleImputer(strategy="median", add_indicator=True), StandardScaler()),
                linear,
            ),
            (
                "spline",
                make_pipeline(SimpleImputer(strategy="median"), SplineTransformer(n_knots=6, degree=3)),
                SMOOTH,
            ),
            ("cat", OneHotEncoder(handle_unknown="ignore"), ["type", "region"]),
            (
                "area",
                OneHotEncoder(min_frequency=min_frequency, handle_unknown="infrequent_if_exist"),
                ["suburb", "council"],
            ),
        ]
    )
    return Pipeline([("pre", pre), ("reg", Ridge(random_state=seed))])
src/housing/models/pipelines.py: gradient boosting31 lines
def _hgb(seed: int) -> Pipeline:
    pre = ColumnTransformer(
        [
            ("num", "passthrough", NUMERIC),  # trees handle missing building area / build year natively
            (
                "cat",
                OrdinalEncoder(
                    handle_unknown="use_encoded_value", unknown_value=-1, encoded_missing_value=-1
                ),
                ["type", "region"],
            ),
            # Cross-fitted encoding of high-cardinality areas: each row's code is learned on other folds.
            (
                "area",
                TargetEncoder(target_type="continuous", cv=KFold(5, shuffle=True, random_state=seed)),
                ["suburb", "council"],
            ),
        ],
        verbose_feature_names_out=True,
    ).set_output(transform="pandas")
    reg = HistGradientBoostingRegressor(
        random_state=seed,
        early_stopping=True,
        validation_fraction=0.1,
        n_iter_no_change=30,
        max_iter=1000,
        # More floor area, all else equal, should never lower the estimate.
        monotonic_cst={"num__log_building_m2": 1},
        categorical_features=["cat__type", "cat__region"],
    )
return Pipeline([("pre", pre), ("reg", reg)])Prediction intervals with conformal prediction
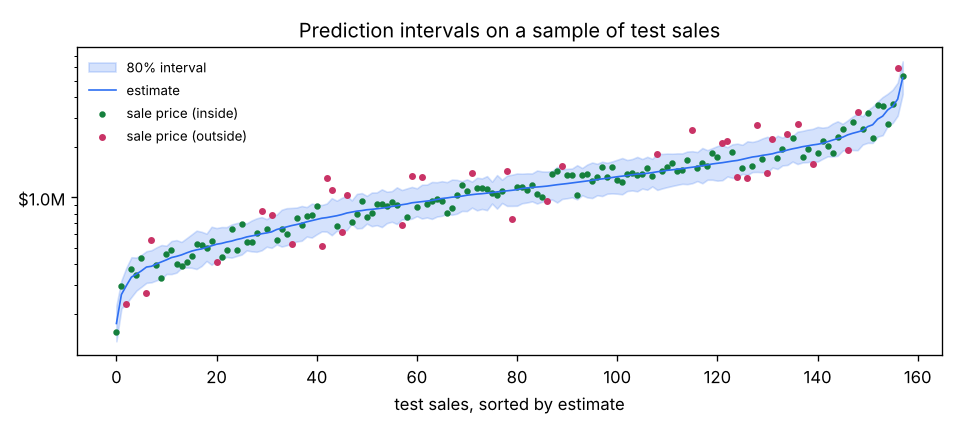
Split-conformal prediction turns any model into one that gives intervals with a target coverage, without assuming errors are normal: take the model's errors on the calibration (validation) period, find the error size that 80% of them stay under (with a small finite-sample correction), and add that much either side of each new estimate.
src/housing/models/intervals.py79 lines
"""Split-conformal prediction intervals, optionally scaled by a difficulty model.

Conformal prediction gives intervals with a guaranteed coverage *on average* for new data that
look like the calibration data, without assuming the errors are normal:

1. Fit the price model on the training period.
2. (Adaptive) Fit a second model that predicts how large the error will be for each property,
   using out-of-fold residuals from the training period.
3. On the calibration (validation) period, compute each sale's normalised error
   ``|y - ŷ| / difficulty`` and take the ``ceil((n + 1) * coverage) / n`` quantile, ``q``.
4. For a new property: ``ŷ ± q * difficulty`` on the log scale, then convert back to dollars.

Coverage is then *checked* on the test period, including by property type, because the guarantee
holds on average, not necessarily for every group.
"""

from __future__ import annotations

from dataclasses import dataclass

import numpy as np
import numpy.typing as npt
import pandas as pd
from sklearn.pipeline import Pipeline

Array = npt.NDArray[np.float64]


def conformal_quantile(scores: npt.ArrayLike, coverage: float) -> float:
    """Finite-sample-corrected quantile of nonconformity scores."""
    s = np.sort(np.asarray(scores, dtype=float))
    n = len(s)
    k = int(np.ceil((n + 1) * coverage)) - 1
    if k >= n:
        raise ValueError(f"need more than {n} calibration rows for {coverage:.0%} coverage")
    return float(s[k])


@dataclass
class ConformalRegressor:
    """A fitted price model plus everything needed to produce calibrated intervals."""

    model: Pipeline
    difficulty: Pipeline | None
    q: float
    coverage: float

    def _scale(self, X: pd.DataFrame) -> Array:
        if self.difficulty is None:
            return np.ones(len(X))
        return np.clip(np.asarray(self.difficulty.predict(X), dtype=float), 0.02, None)

    def predict_log(self, X: pd.DataFrame) -> Array:
        """Point prediction of log price."""
        return np.asarray(self.model.predict(X), dtype=float)

    def predict(self, X: pd.DataFrame) -> Array:
        """Point estimate in dollars (exp of the log prediction: a median-type estimate)."""
        return np.exp(self.predict_log(X))

    def predict_interval(self, X: pd.DataFrame) -> tuple[Array, Array, Array]:
        """Return (estimate, low, high) in dollars."""
        mid = self.predict_log(X)
        half = self.q * self._scale(X)
        return np.exp(mid), np.exp(mid - half), np.exp(mid + half)

    @classmethod
    def calibrate(
        cls,
        model: Pipeline,
        difficulty: Pipeline | None,
        X_cal: pd.DataFrame,
        y_cal_log: npt.ArrayLike,
        coverage: float,
    ) -> ConformalRegressor:
        """Compute ``q`` on calibration data the price model has never seen."""
        tmp = cls(model, difficulty, 1.0, coverage)
        scores = np.abs(np.asarray(y_cal_log, dtype=float) - tmp.predict_log(X_cal)) / tmp._scale(X_cal)
        return cls(model, difficulty, conformal_quantile(scores, coverage), coverage)
tests: coverage really reaches the target15 lines
def test_conformal_intervals_reach_target_coverage() -> None:
    rng = np.random.default_rng(1)

    def data(n: int) -> tuple[pd.DataFrame, np.ndarray]:
        x = rng.uniform(0, 10, n)
        return pd.DataFrame({"x": x}), 12 + 0.1 * x + rng.normal(0, 0.2, n)

    Xtr, ytr = data(2000)
    Xcal, ycal = data(2000)
    Xte, yte = data(20000)
    model = make_pipeline(LinearRegression()).fit(Xtr, ytr)
    cr = ConformalRegressor.calibrate(model, None, Xcal, ycal, 0.8)
    _, lo, hi = cr.predict_interval(Xte)
    cover = interval_quality(np.exp(yte), lo, hi)["coverage"]
assert 0.78 <= cover <= 0.83Make intervals adapt to each property
A constant-width interval is too wide for a typical suburban unit and too narrow for a unique mansion. A small difficulty model predicts how large the error will be for each property, trained on out-of-fold residuals from the training period (never on errors the price model has already fitted). Conformal calibration then scales by it, so intervals widen where the model is less sure.
src/housing/models/train.py8 lines
def _difficulty_model(best: Pipeline, cfg: Config, split: Split) -> Pipeline:
    """Model of |log error| per property, trained on out-of-fold residuals (never in-sample)."""
    X, y = split.train[FEATURES], split.train[TARGET]
    oof = cross_val_predict(clone(best), X, y, cv=address_folds(split.train, cfg.split.cv_folds))
    diff = build("hist_gradient_boosting", cfg.project.seed).set_params(
        reg__loss="absolute_error", reg__max_leaf_nodes=15, reg__min_samples_leaf=80, reg__monotonic_cst=None
    )
return diff.fit(X, np.abs(y - oof))Evaluate once, in dollars and percentages
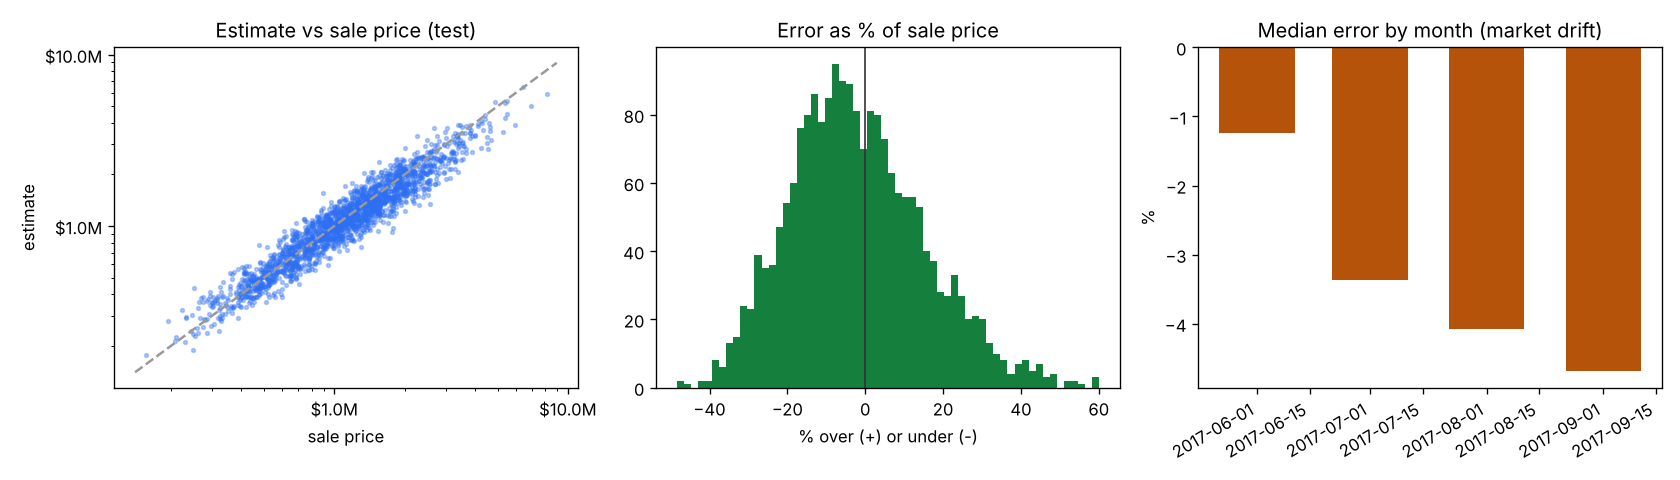
On the untouched test period: mean absolute error in dollars, mean and median absolute % error, share within 10% and 20%, all next to the baseline, with bootstrap 95% intervals.
src/housing/evaluation/metrics.py13 lines
def score(price: npt.ArrayLike, pred: npt.ArrayLike) -> dict[str, float]:
    """All headline regression metrics, computed on the dollar scale (and log scale where noted)."""
    y, p = _arr(price), _arr(pred)
    ape = np.abs(p - y) / y
    return {
        "mae": mae(y, p),
        "mape": float(ape.mean()),
        "median_ape": float(np.median(ape)),
        "within_10pct": float((ape <= 0.10).mean()),
        "within_20pct": float((ape <= 0.20).mean()),
        "rmse_log": float(np.sqrt(np.mean((np.log(p) - np.log(y)) ** 2))),
        "r2_log": float(r2_score(np.log(y), np.log(p))),
}Check interval coverage
Coverage is a promise: about 80% of sale prices should fall inside their interval. Check it on the test period overall and for each property type and price band. A guarantee "on average" can still fail for a subgroup.
Analyse errors by group
Automated valuations can quietly be worse for some areas or price ranges. Report % error, bias (does it over- or under-estimate?) and coverage by property type, region and price quarter, and flag any group with more than 1.5× the overall error.
src/housing/evaluation/report.py23 lines
def group_errors(
    df: pd.DataFrame, by: str | pd.Series, name: str, overall_mape: float, max_ratio: float
) -> list[dict[str, Any]]:
    """Accuracy and interval coverage per group; flags groups much worse than overall."""
    rows = []
    for value, g in df.groupby(by, observed=True):
        if len(g) < 30:
            continue
        m = mape(g["price"], g["pred"])
        rows.append(
            {
                "group": name,
                "value": str(value),
                "n": len(g),
                "median_price": float(g["price"].median()),
                "mae": mae(g["price"], g["pred"]),
                "mape": m,
                "bias_pct": float(np.median(g["pred"] / g["price"] - 1)),
                "coverage": float(((g["price"] >= g["low"]) & (g["price"] <= g["high"])).mean()),
                "review": m > max_ratio * overall_mape,
            }
        )
return rowsExplain the model
Permutation importance on the validation period and partial-dependence plots for distance, floor area and age. Check the story: prices should fall with distance, rise with floor area, and age should matter less than location. A surprising top feature is often a leak.
Write the model card
Generated by make evaluate: intended and out-of-scope uses, data period, metrics with intervals and the baseline, coverage,
accuracy by group, drivers and limitations, including the market moving after the data ends.
model card template (excerpt)6 lines
## Intended use
Give a buyer, seller or analyst a **range** for what a Melbourne property might sell for, as a starting point for their own
research. Every estimate is shown with its interval.

**Out of scope:** lending, insurance or rental decisions about a specific person or property without a professional valuation;
any market or period far from the training data (the market moves; see Limitations).Test data, intervals, model and API
39 tests: validation rules, repair-not-drop cleaning, leakage guards, time and group splits, metric arithmetic, conformal coverage on simulated data, model behaviour (positive estimates inside their interval, monotonic in floor area, unseen suburbs and missing fields handled), training-serving parity, and the API contract.
tests/test_model_and_api.py: a behaviour test10 lines
def test_more_floor_area_never_lowers_the_estimate_on_average(
    bundle: dict[str, Any], test_rows: pd.DataFrame
) -> None:
    rows = test_rows[FEATURES].head(200).copy()
    means = []
    for area in (80, 120, 160, 220, 300):
        rows["log_building_m2"] = np.log1p(area)
        rows["building_m2_per_room"] = area / rows["rooms"]
        means.append(bundle["model"].predict(rows).mean())
assert all(b >= a * 0.999 for a, b in zip(means, means[1:], strict=False)), meansServe estimates with ranges
POST /v1/estimate validates each property (type codes, ranges, coordinates inside Melbourne, consistency between rooms and
bedrooms, build year not after the valuation date), returns the estimate and interval rounded to the nearest $1,000, and flags
out_of_period when the valuation date is more than six months after the training data.
src/housing/serving/schemas.py30 lines
class Property(BaseModel):
    """One property to value, as of ``valuation_date``."""

    model_config = ConfigDict(extra="forbid")

    property_id: str = Field(min_length=1, max_length=64)
    valuation_date: date
    suburb: str = Field(min_length=1, max_length=60)
    region: str = Field(min_length=1, max_length=60)
    council: str | None = Field(default=None, max_length=60)
    type: Literal["h", "t", "u"] = Field(description="h = house, t = townhouse, u = unit")
    rooms: int = Field(ge=1, le=12)
    bedrooms: int | None = Field(default=None, ge=0, le=12)
    bathrooms: int | None = Field(default=None, ge=0, le=10)
    car_spaces: int | None = Field(default=None, ge=0, le=12)
    land_m2: float | None = Field(default=None, ge=0, le=100000)
    building_m2: float | None = Field(default=None, gt=0, le=3000)
    year_built: int | None = Field(default=None, ge=1800)
    distance_km: float = Field(ge=0, le=80)
    lat: float = Field(ge=-38.6, le=-37.3)
    lon: float = Field(ge=144.3, le=145.7)
    suburb_property_count: int | None = Field(default=None, ge=1)

    @model_validator(mode="after")
    def _consistent(self) -> Property:
        if self.year_built is not None and self.year_built > self.valuation_date.year + 1:
            raise ValueError("year_built is after the valuation date")
        if self.bedrooms is not None and self.bedrooms > self.rooms + 1:
            raise ValueError("bedrooms cannot exceed rooms by more than one")
return selfsrc/housing/serving/app.py79 lines
def create_app(model_path: str | Path | None = None) -> Flask:
    """Application factory: loads the model bundle once at start-up."""
    app = Flask(__name__)
    app.config["MAX_CONTENT_LENGTH"] = MAX_BODY_BYTES
    path = Path(model_path or os.environ.get("MODEL_PATH", "models/model.joblib"))
    bundle: dict[str, Any] = joblib.load(path)
    model, version, coverage = bundle["model"], str(bundle["version"]), float(bundle["coverage"])
    last_sale = pd.Timestamp(bundle["train_last_sale"])
    logging.basicConfig(level=logging.INFO, format="%(asctime)s %(levelname)s %(name)s: %(message)s")
    log.info("loaded model %s from %s", version, path)

    @app.before_request
    def _start() -> None:
        g.t0, g.request_id = time.perf_counter(), request.headers.get("X-Request-ID", uuid.uuid4().hex[:12])

    @app.after_request
    def _finish(resp: Response) -> Response:
        resp.headers["X-Request-ID"] = g.request_id
        resp.headers["X-Model-Version"] = version
        log.info(
            "request_id=%s %s %s status=%s ms=%.1f",
            g.request_id,
            request.method,
            request.path,
            resp.status_code,
            (time.perf_counter() - g.t0) * 1000,
        )
        return resp

    @app.get("/health")
    def health() -> Response:
        return jsonify(status="ok", model_version=version)

    @app.post("/v1/estimate")
    def estimate() -> tuple[Response, int]:
        body = request.get_json(silent=True)
        if body is None:
            return jsonify(
                error="invalid_json", message="send a JSON body with Content-Type: application/json"
            ), 400
        try:
            req = EstimateRequest.model_validate(body)
        except ValidationError as e:
            problems = [
                {"field": ".".join(map(str, err["loc"])), "message": err["msg"]} for err in e.errors()
            ]
            return jsonify(error="invalid_request", problems=problems), 422
        mid, low, high = model.predict_interval(to_features(req))
        out = [
            Estimate(
                property_id=p.property_id,
                estimate=int(round(float(m), -3)),
                low=int(round(float(lo), -3)),
                high=int(round(float(hi), -3)),
                out_of_period=(pd.Timestamp(p.valuation_date) - last_sale).days > STALE_AFTER_DAYS,
            )
            for p, m, lo, hi in zip(req.properties, mid, low, high, strict=True)
        ]
        log.info(
            "request_id=%s valued=%d stale=%d", g.request_id, len(out), sum(e.out_of_period for e in out)
        )
        return jsonify(
            EstimateResponse(model_version=version, coverage=coverage, estimates=out).model_dump()
        ), 200

    @app.errorhandler(404)
    def not_found(_: Exception) -> tuple[Response, int]:
        return jsonify(error="not_found", message="see /health and /v1/estimate"), 404

    @app.errorhandler(413)
    def too_large(_: Exception) -> tuple[Response, int]:
        return jsonify(error="payload_too_large", message=f"limit is {MAX_BODY_BYTES} bytes"), 413

    @app.errorhandler(500)
    def server_error(_: Exception) -> tuple[Response, int]:
        log.exception("request_id=%s failed", getattr(g, "request_id", "?"))
        return jsonify(error="internal_error", message="the error has been logged"), 500

return appDocker and CI
The same production Dockerfile and GitHub Actions workflow as Project 1: lint, strict types, tests with coverage, and a pipeline smoke run on synthetic data on every push.
.github/workflows/ci.yml28 lines
name: ci
on:
  push:
  pull_request:

jobs:
  check:
    runs-on: ubuntu-latest
    steps:
      - uses: actions/checkout@v4
      - uses: actions/setup-python@v5
        with:
          python-version: "3.12"
          cache: pip
      - name: Install
        run: |
          python -m pip install -r requirements-dev.txt
          python -m pip install -e . --no-deps
      - name: Lint
        run: ruff check . && ruff format --check .
      - name: Type check
        run: mypy
      - name: Tests (synthetic data, no Kaggle account needed)
        run: python -m pytest --cov=housing --cov-report=term-missing
      - name: Pipeline smoke run on synthetic data
        run: |
          python scripts/make_synthetic.py --rows 6000 --out data/raw/melb_data.csv
          make all CONFIG=configs/ci.yaml
Monitor a moving market
House prices drift, so monitoring focuses on bias and coverage on newly settled sales each month, plus input drift and the share of requests flagged as out of period. Retrain quarterly, or sooner when bias or coverage breaks its threshold.
docs/monitoring.md19 lines
# Monitoring and retraining plan

| what | how | how often | warn | act |
|---|---|---|---|---|
| Service health | `/health`, error rate, p95 latency | continuous | error rate > 1% | > 2% for 5 min |
| Stale requests | share of requests flagged `out_of_period` | daily | > 10% | retrain on recent sales |
| Input drift | PSI per feature (`housing monitor --current ...`) | monthly | PSI ≥ 0.10 | PSI ≥ 0.25 on a top feature |
| Accuracy on new sales | median % error and bias, by type and region | monthly, once sale prices are known | bias beyond ±5% | retrain |
| Interval coverage | share of new sale prices inside the 80% interval | monthly | outside 75–85% | recalibrate on recent sales |

## Retraining policy
1. **Schedule:** quarterly, or sooner when monthly bias or coverage breaks its threshold. Markets move; trees cannot extrapolate.
2. **Data:** all sales up to the cut-off; the latest period is the test set.
3. **Gates:** tests pass; beats the baseline; coverage within 75–85% overall and for houses, units and townhouses.
4. **Shadow:** score live requests with the candidate for two weeks; compare with the live model on sales that settle.
5. **Release and rollback:** switch `MODEL_PATH`; keep the previous bundle for one-step rollback.

## Logged per request
Request id, model version, number valued, number flagged stale, latency. No addresses or other personal data.
Present it in your portfolio
- Show an estimate with its range in your README: it immediately signals maturity.
- Include the coverage table by property type and the "error by month" chart, and explain what it says about markets.
- In interviews, talk about the leakage review (why
Methodwas excluded), repair-not-drop cleaning, and conformal intervals.